

Usage
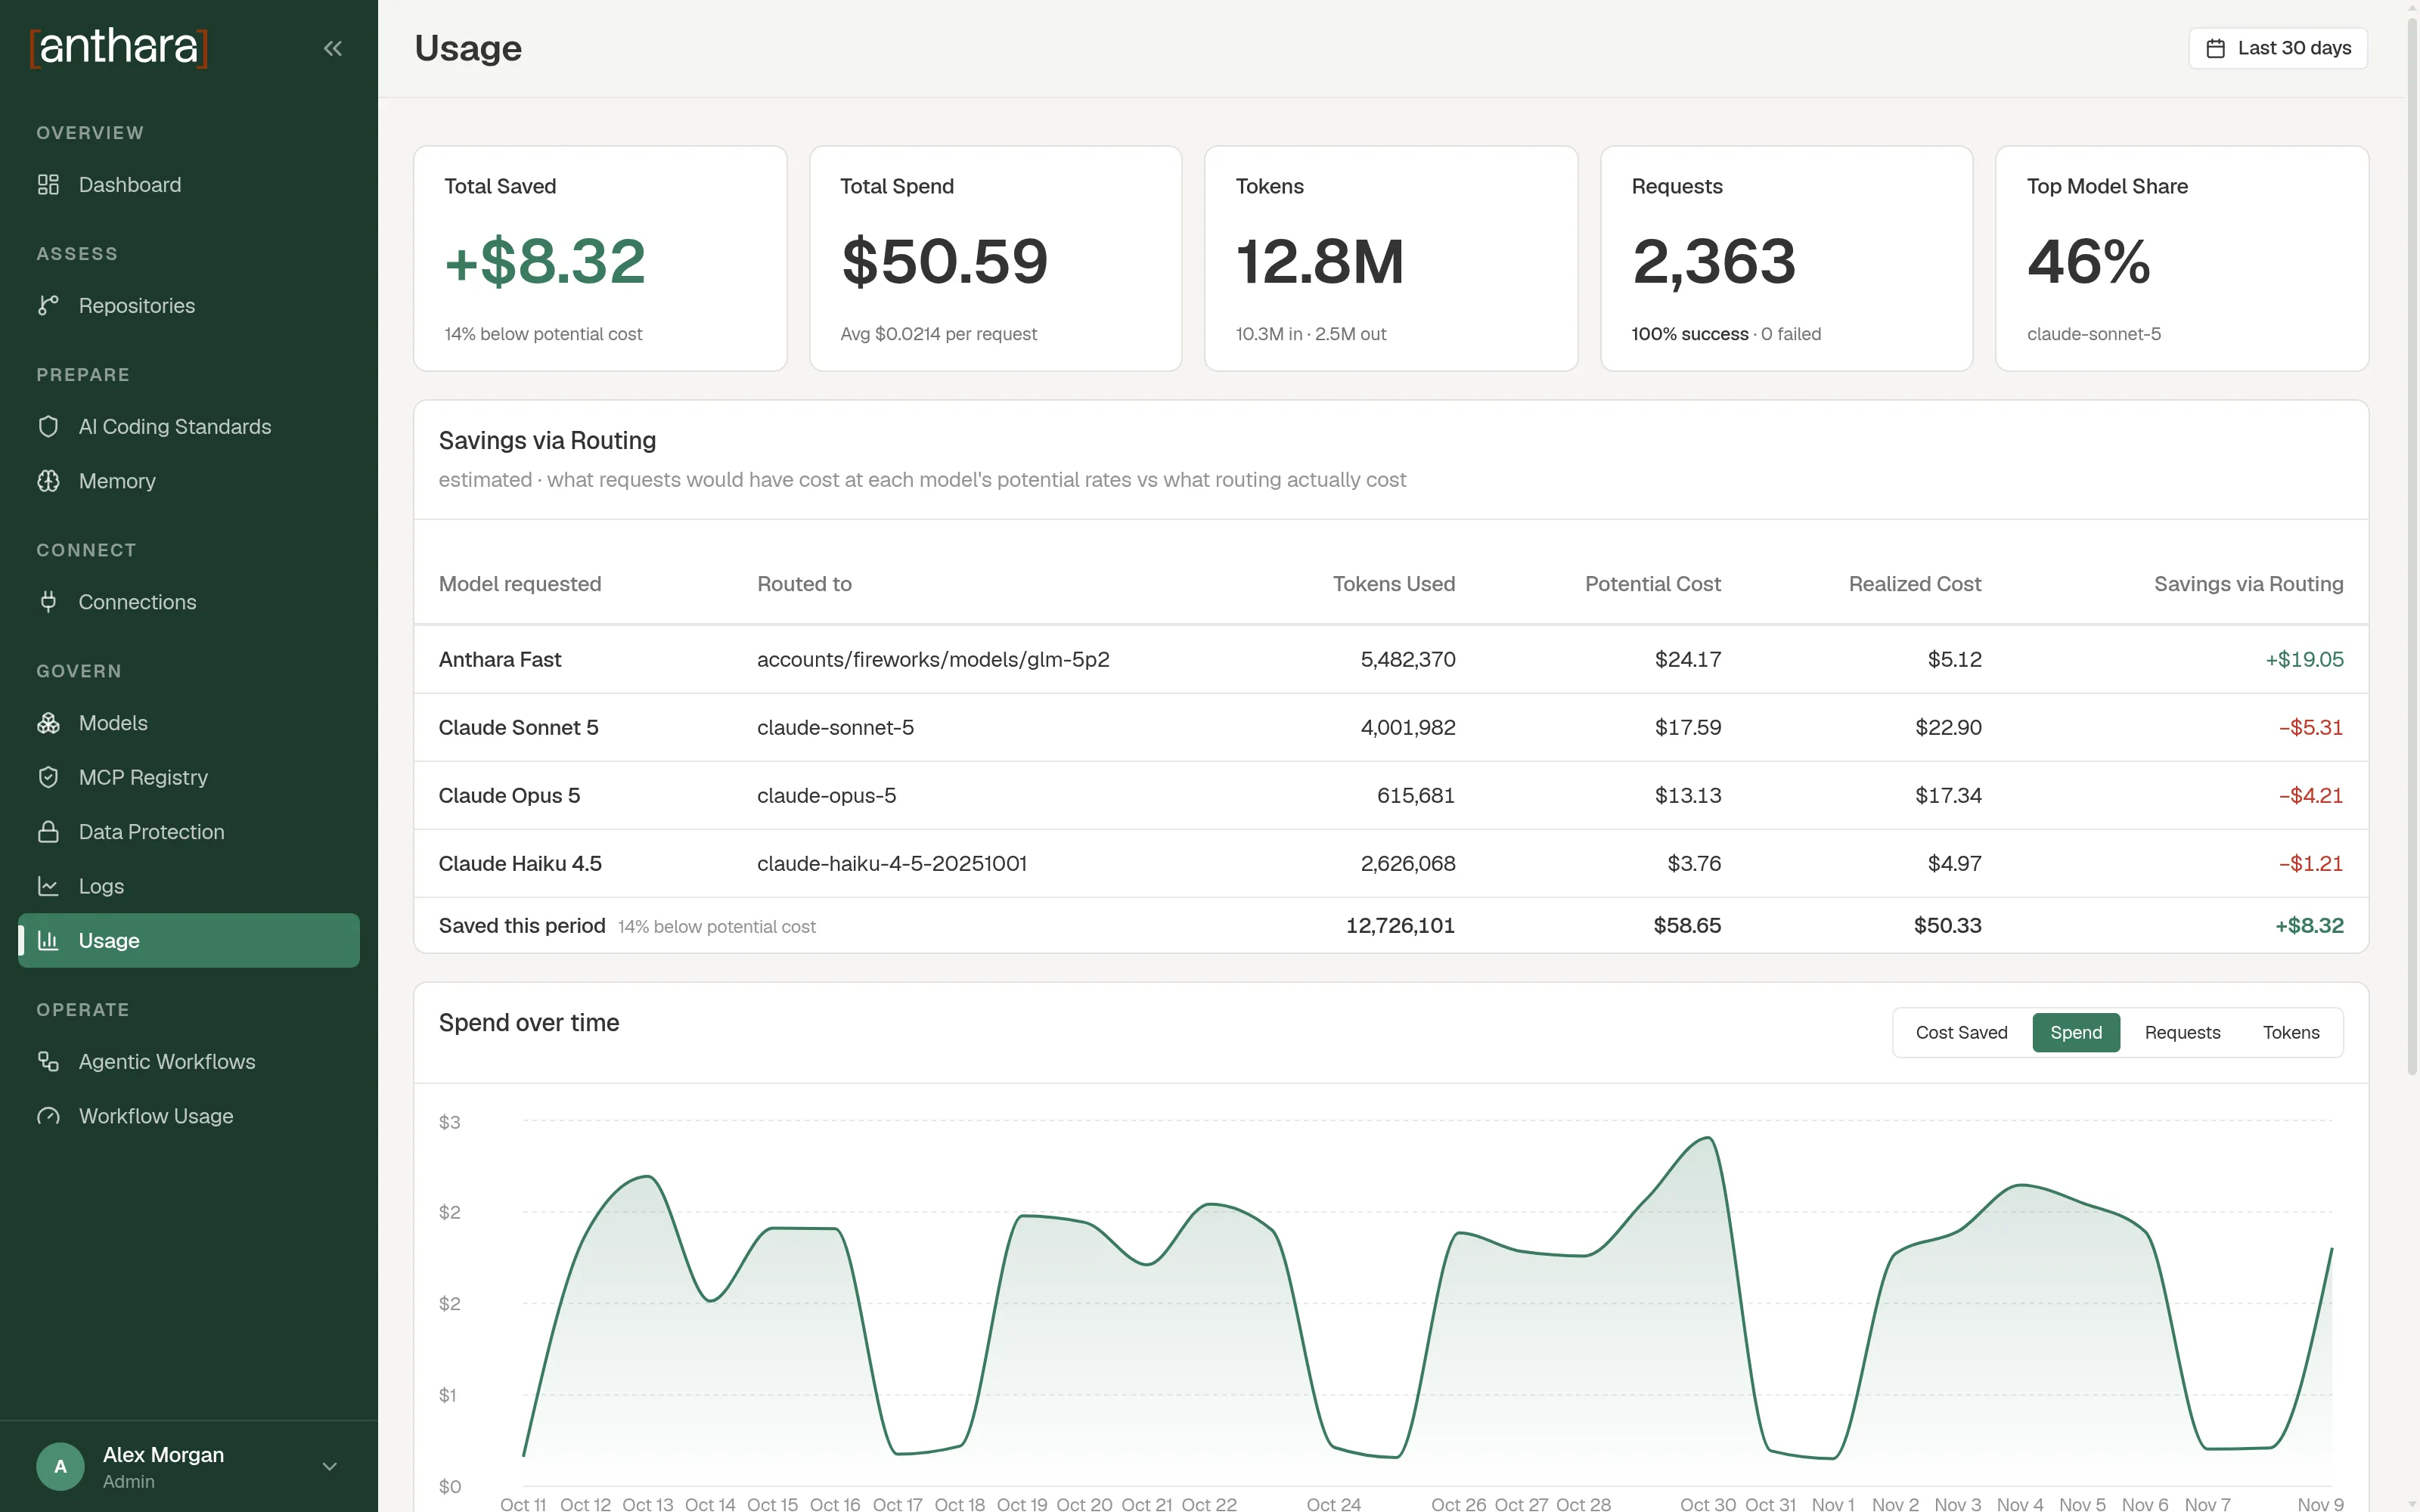
The Usage page shows what your organization spent on model traffic through the LLM Proxy. It also shows how much routing requests to a cheaper model saved.
Only admins can open this page. It is under Govern in the sidebar.
Choose a time range
Section titled “Choose a time range”Use the range picker at the top of the page. The page opens on Last 30 days.
The options are Today, Last 7 days, Last 30 days, Month to date, Year to date, and Custom range.
The tiles
Section titled “The tiles”| Tile | What it shows |
|---|---|
| Total Spend | The cost of all requests in the range, with the average cost per request. |
| Tokens | Total tokens, split into input and output. |
| Requests | The number of requests. |
| Top Model Share | The model that took the largest share of spend. |
| Total Saved | The difference between potential cost and realized cost. |
Total Saved needs at least one model with potential cost rates. Without them it shows No models priced for comparison. You enter the rates on the Models page.
Savings via Routing
Section titled “Savings via Routing”This table compares two costs for each registered model.
| Column | Meaning |
|---|---|
| Model requested | The name clients asked for. |
| Routed to | The model that served the requests. |
| Tokens Used | Tokens for this pair in the range. |
| Potential Cost | What the tokens would have cost at the requested model’s own rates. |
| Realized Cost | What the tokens actually cost at the routed model. |
| Savings via Routing | Potential cost minus realized cost. |
The last row shows the total saved for the period.
Trends
Section titled “Trends”The trend chart plots one metric over time. Choose Spend, Requests, Tokens, or Cost Saved.
- Requests splits each bar into successful and failed requests.
- Tokens splits each bar into cache read, cache write, fresh input, and output.
Breakdown
Section titled “Breakdown”The Breakdown table groups the same data three ways: By Routed Model, By Model Requested, and By User.
| Column | Meaning |
|---|---|
| Spend | Cost for this group. |
| Share of spend | This group’s part of the total. |
| Requests | Number of requests. |
| Success | The share of requests that succeeded. |
| Tokens | Tokens used. |
| Avg / req | Average cost per request. |
What is not counted
Section titled “What is not counted”The page only counts traffic that passed through the LLM Proxy. Network and data flows lists the traffic that can bypass it.
For workflow cost and outcomes, see Workflow Usage.