

Dashboard
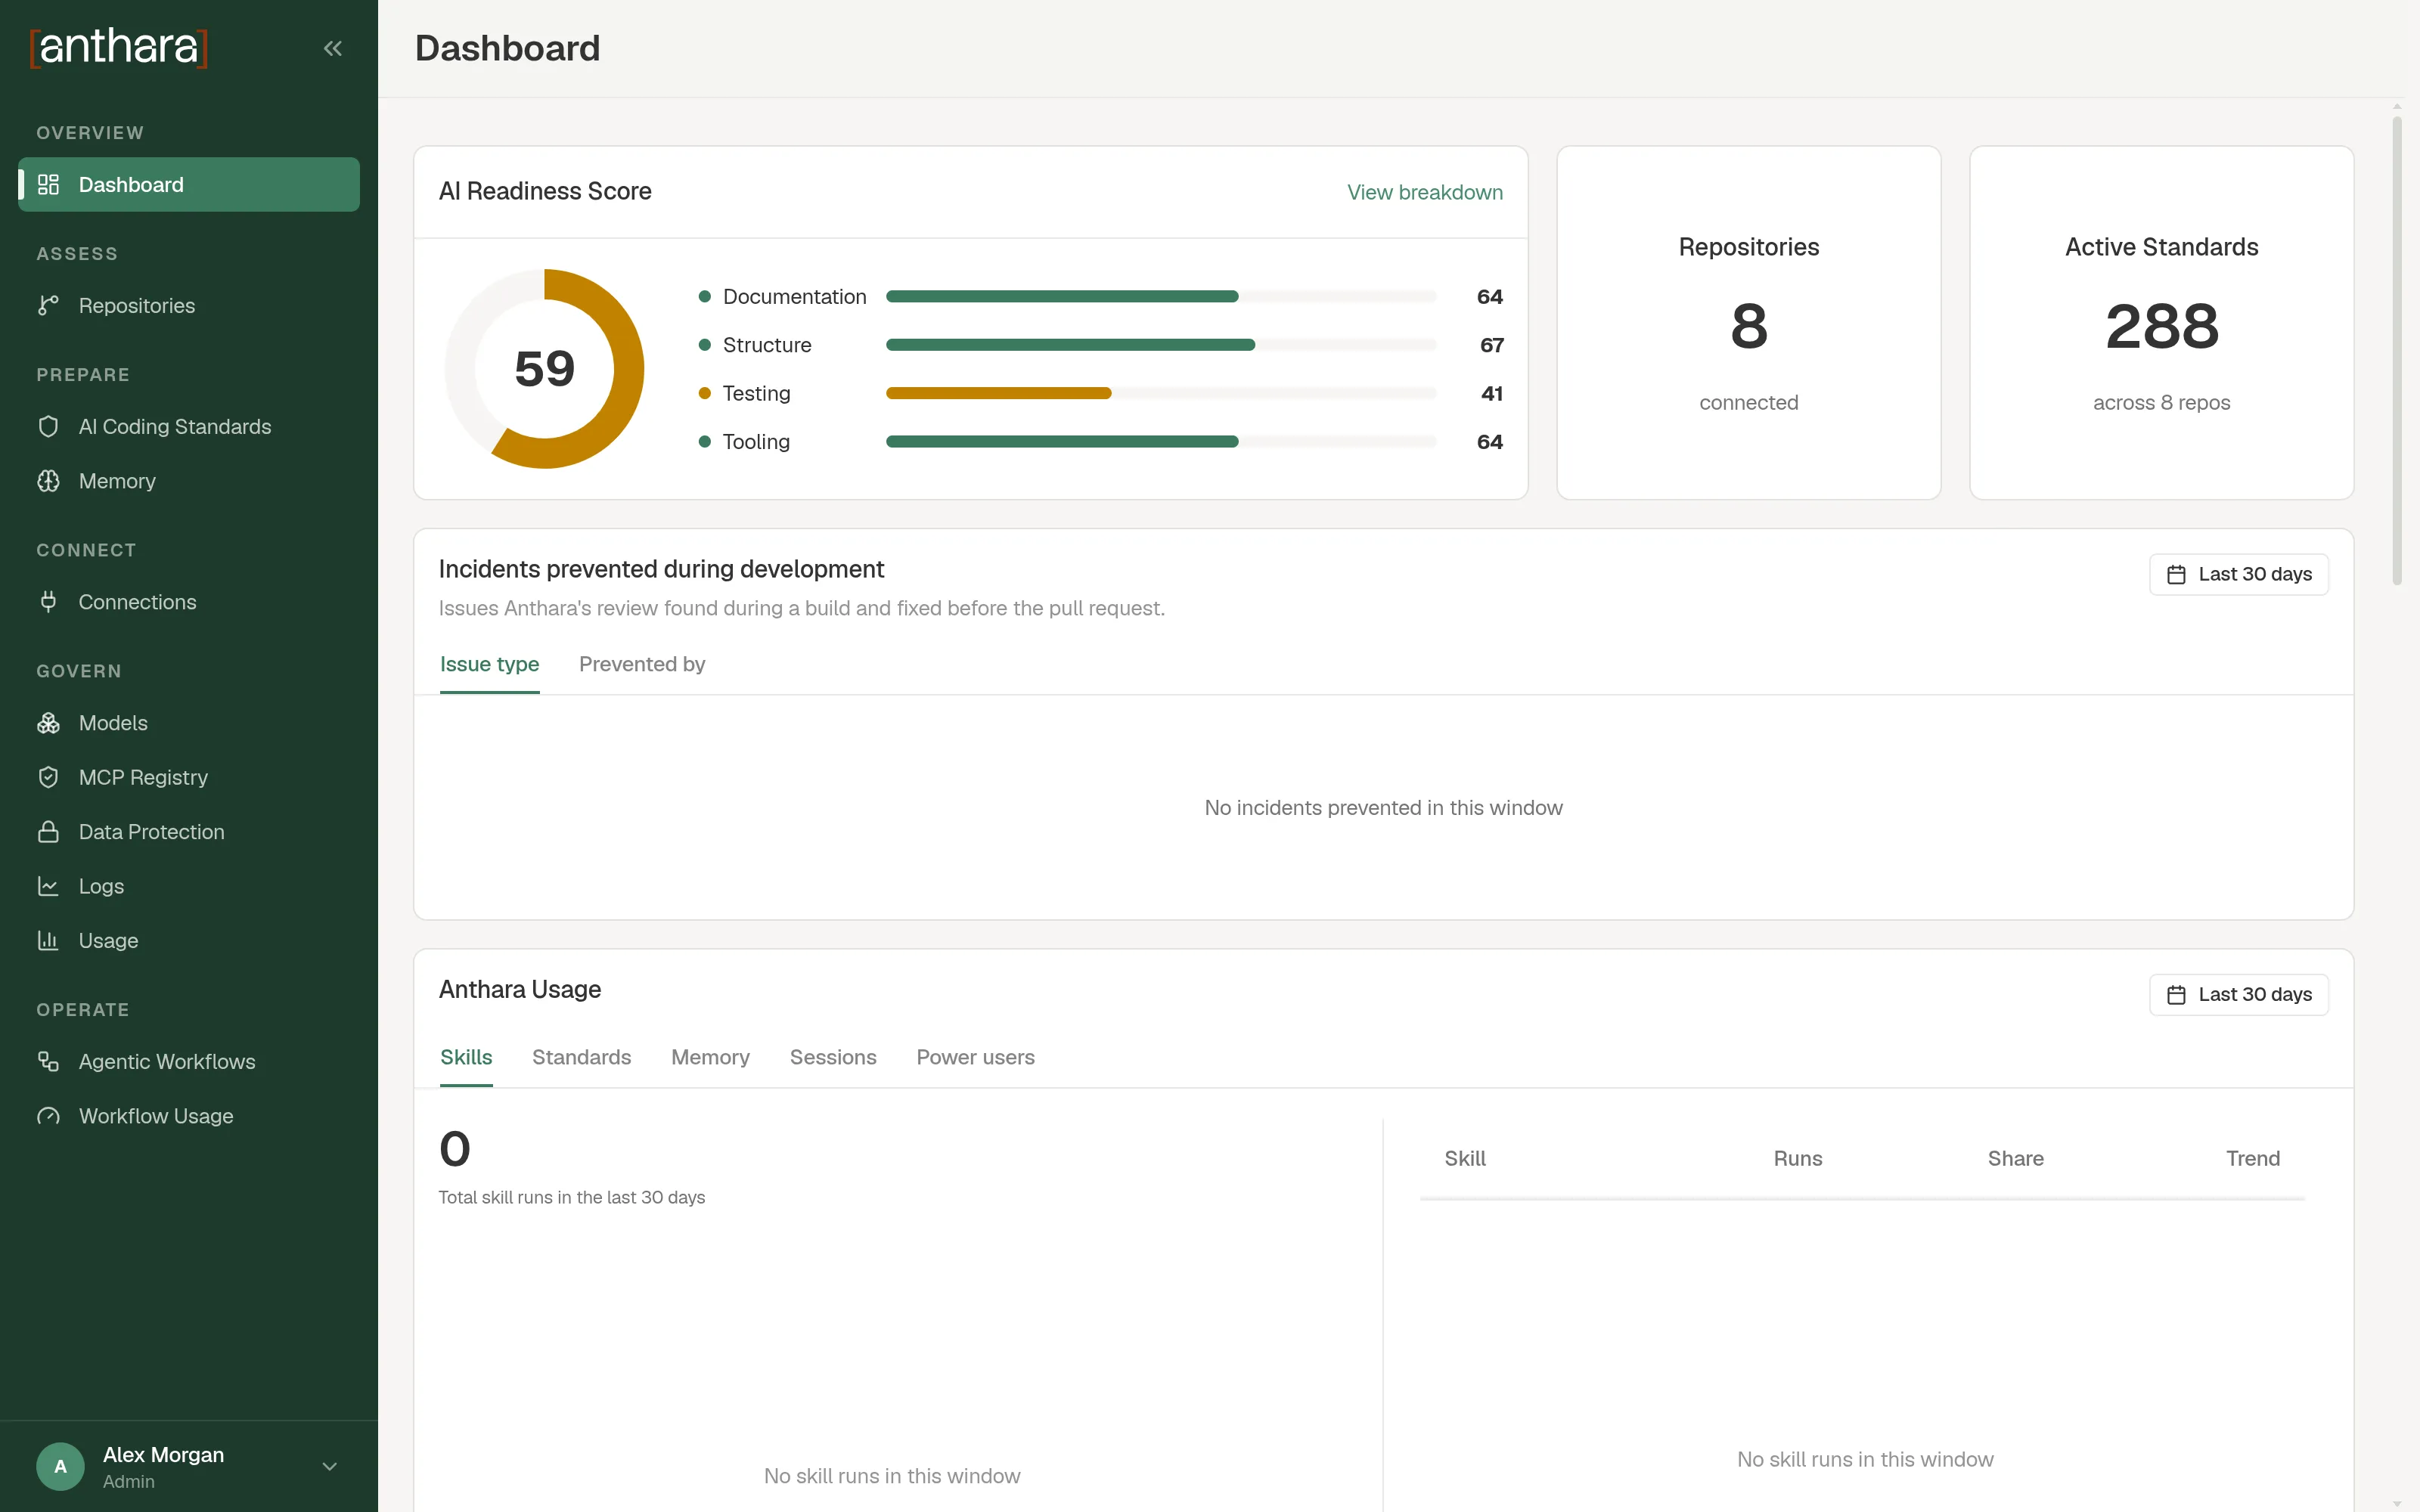
The Dashboard is the first page you see after you sign in. It summarizes your repositories, your standards, and how Anthara is being used. This page explains each card from top to bottom.
The numbers for repositories and assessments are your own. They cover the repositories that you imported.
AI Readiness Score
Section titled “AI Readiness Score”The average readiness of your assessed repositories. It shows one overall score and four bars: Documentation, Structure, Testing, and Tooling. Select View breakdown to see the repositories behind the score.
For how the score is calculated, see AI Readiness Score.
Repositories and Active Standards
Section titled “Repositories and Active Standards”| Card | What it shows | Opens |
|---|---|---|
| Repositories | How many repositories you connected. | Repositories |
| Active Standards | How many standards are active, and across how many repositories. | AI Coding Standards |
Incidents prevented during development
Section titled “Incidents prevented during development”A chart and a table of the problems caught during development. It has two tabs:
- Issue type groups the problems by kind.
- Prevented by groups them by the standards pack that caught them.
Anthara Usage
Section titled “Anthara Usage”How your team uses the plugin. It has five tabs: Skills, Standards, Memory, Sessions, and Power users.
AI Usage
Section titled “AI Usage”Model spend and requests. Only admins see this card. Select View full usage to open Usage.
Workflow Impact
Section titled “Workflow Impact”A summary of what your workflows delivered. Select View full usage to open Workflow Usage.
Recent Assessments
Section titled “Recent Assessments”The latest repository assessments, with the columns Repository, Rating, and Last Scanned. Select View all to open Repositories.